How to Calculate RCV with SurveyMonkey and Microsoft Excel
What is Ranked Choice Voting?
Ranked choice voting is a voting system where voters can select their most preferred choices on a ballot – first, second, third, and so on – instead of just voting for a single choice. If no candidate receives enough first ranked votes to win a majority, the lowest vote-getter is eliminated. Anyone who voted for the eliminated candidate has their vote redistributed to their next ranked choice.
This elimination and redistribution process repeats until a choice receives enough votes to win.
Why use Ranked Choice Voting?
Any time you're making a decision with more than two choices and where voters have equal say, ranked choice voting is the right tool for the job. It uncovers preferences with greater accuracy and fidelity than traditional voting methods.
Steps to Calculate RCV using SurveyMonkey and Microsoft Excel
Depending on number of candidates and voters
Determine the decision that needs to be made
The first step is to get crisp on what decision needs to be made. Ranked choice voting works great in situations where you’re making a decision amongst a group of people with equal say. Groups like teams, organizations, and fan communities. This makes it differ from techniques like “weighted voting” or “100-point exercises.”
Fantastic uses for ranked choice voting include: selecting leadership, prioritizing work, running contests, and choosing award winners.
Once you know the decision that needs to be made, it’s time to start creating the form.
Create the Survey
Go to SurveyMonkey and click “Sign Up” in the upper right corner. This will take you through a typical account creation process.
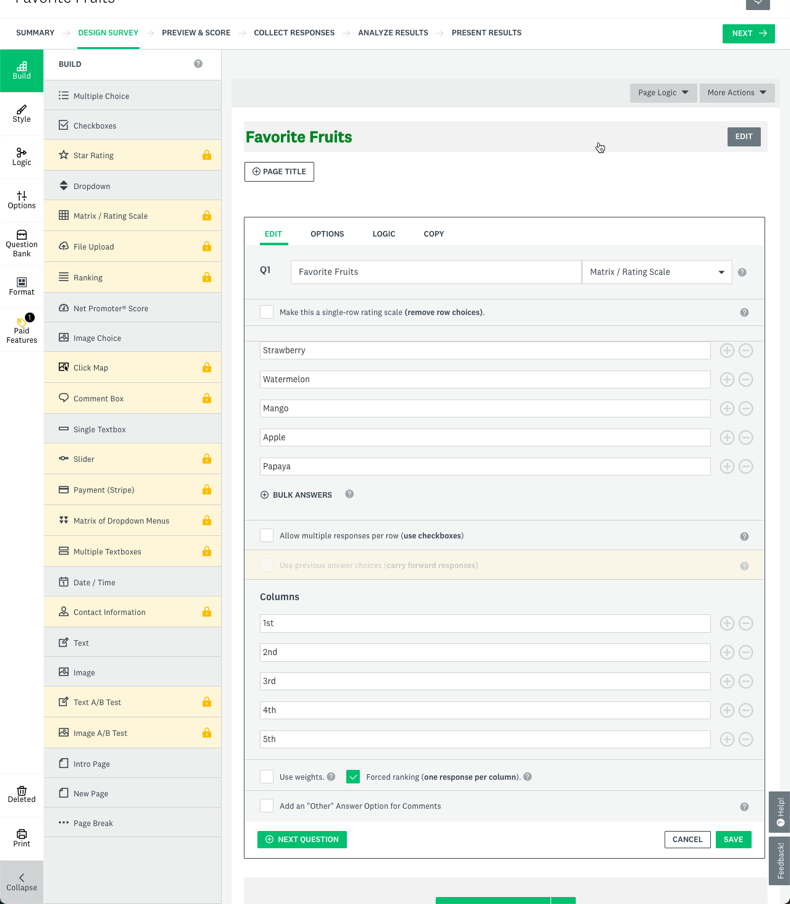
Once you’re through the account creation and onboarding wizard, you’ll want to “Design Survey” and make sure you’re on the “Build” tab. Give your survey a title. This should be the decision you’re trying to make (e.g. “Favorite Fruits” in the example screenshot).
Next, select the “Matrix / Rating Scale” from the build menu (if a question is automatically added to your survey, select “Matrix / Rating Scale” from the question type dropdown. This format most closely mimics the ranked choice ballots that are used for elections in New York City, Maine, and Alaska.
NOTE: This question type is a paid feature of SurveyMonkey. You’ll also be limited on the number of responses you can collect.
In the “Enter your question” field you can either repeat the title (“Favorite Fruits”), include directions (“Rank up to 5 choices”), or leave it blank by putting in “...” or other placeholder text.
The choices will be the Rows (e.g. “Strawberry”) and the Columns the ranking position (e.g. “1st”). This both more closely mimics the real-world ballots and helps with running the ranked choice calculations later on.
Uncheck the “Use weights” check box. This will simplify the eventual data export. It’s also more aligned with the spirit of ranked choice voting.
NOTE: The purpose of ranked choice voting is to determine which choice an individual voter’s one vote counts towards. It’s not about dividing up points amongst multiple choices or showing the intensity an individual voter feels towards a specific choice.
Check the “Forced ranking” check box to ensure your voters don’t mark multiple choices with the same rank or one choice with multiple ranks.
Click the green “Save” button to finish. Then click the green “Next” button towards the upper right.
Share the Survey with your voters
You’ve now got a ranked choice form ready to go! Time to send it to your voters. Click the “Share a survey link” button in the upper left. It’s the most versatile option and can be placed wherever you need. SurveyMonkey also allows for other methods, but many of them are paid options only.
As voters fill out the form, you’ll see the results show in the “Analyze Results” tab.

Get the Response Data into Microsoft Excel
Once all the votes are in, it’s spreadsheet calculation time! 🎉
Click on the “Analyze Results” tab in SurveyMonkey. In the upper right, there’s a green “Save As” button. Click it and then go to “Export file” and then choose the “All individual responses” responses.
Why that option instead of summary data? In ranked choice voting, it’s the individual voter’s preferences that matter. If Voter Steve ranks Candidate Sarah as his first ranked choice and then Candidate Sarah is eliminated, what matters is Voter Steve’s next ranked choice (individual response). Not the fact that voters who voted for Candidate Sarah tended to prefer Candidate Hank next (summary responses).

You’ll then get a download screen. The following options work best:
- Tab: All Responses Data
- File Format: XLS (CSV will also work, but XLS is formatted more nicely)
- Data View: Current View
- Columns: Condensed
- Cells: Actual Answer text

After clicking the green “Export” button, a ZIP file will download to your computer. Unzip it and a folder titled “Excel” will appear. Inside that folder is a file called “[Your Survey Name].xlsx (e.g. “Favorite Fruits.xlsx” in this example).
When you open the file, it should look something like this…
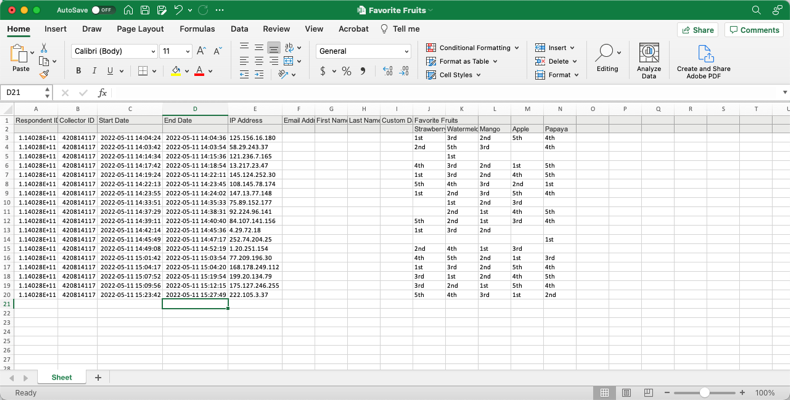
This example has 18 votes. Each row represents a voter’s ballot. Each column after Timestamp represents that voter’s rank for each candidate. Some cells are open, which is fine. This just means that the voter didn’t rank all the options on that ballot.
If all is looking well, duplicate the sheet. To do this, right-click the tab in the lower left called “Sheet” and then select “Move or Copy.” Then choose “(move to end)” and make sure the “Create a copy” checkbox is checked before clicking “Ok.”
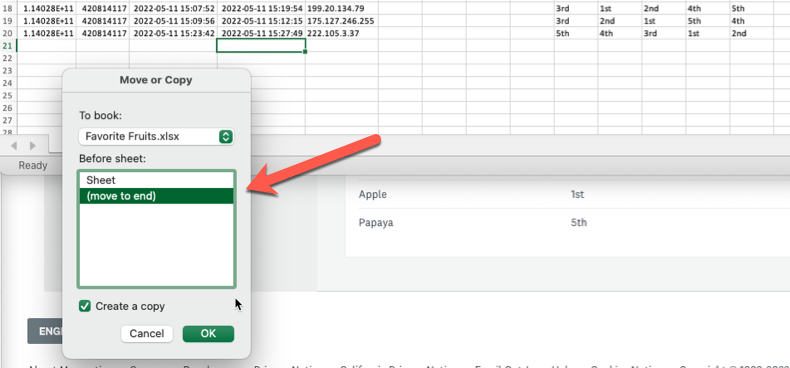
Rename the new sheet “Round 1.” It’s best to leave “Sheet” untouched in case any mistakes are made later. This way, there’s always a way to get back to the original raw data. If you want, you can rename “Sheet” to something more informative like “Responses” or “Original Data.”
Determine how many votes are needed to win
The point of any ranked choice voting round is to determine a winner. But, what does it take to win?
A core idea of ranked choice voting is that the winner should have majority support from the voters. For a single-winner election, that means 50%+1. To win this example election, the winner needs 10 votes (50% of 18 is 9. Plus 1 is 10).
Calculate Round 1
Now that all the votes are in and a winning threshold has been determined, we can start the calculations. Round 1 is relatively straightforward as it simply involves adding up all the first ranked choices each candidate received.
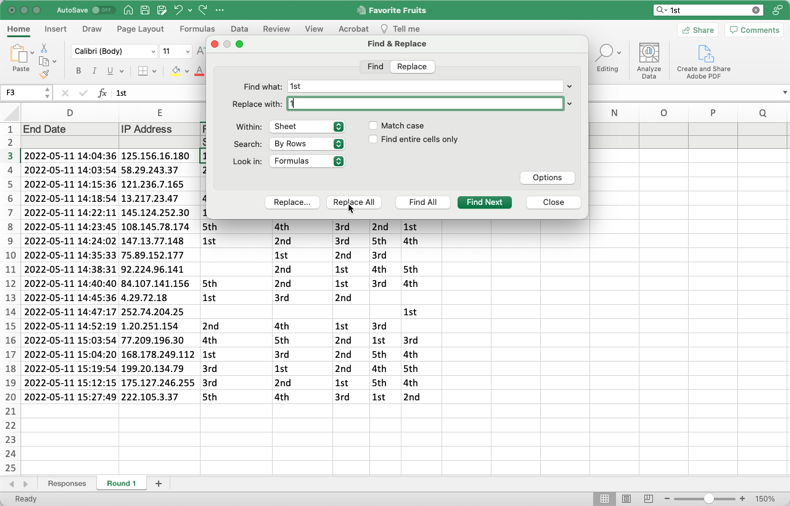
To make the spreadsheet able to be added up, you’ll do a “Find and replace” of the text “1st” and replace it with just the number “1.” Microsoft Excel ignores any text-based cells, but will add up any numeric cells in a column.

From Home click “Editing” > “Find and Select” > “Replace” to bring up the menu. Fill it out like in the image below. It’s very important to make sure the “Within” field is set to “Sheet” so that you don’t impact the original voting data. Then, hit the “Replace all” button. You should see that there were a number of instances of “1st” replaced. Click “Close” to finish.
The columns can now be added up. Clicking the column header will automatically display the Sum in the lower right corner. That’s a quick way to get a read on the vote totals for each candidate and if any of them managed to clear the winning threshold in Round 1.
However, chances are that didn’t happen. A more enduring solution is to create a cell with the vote totals at the bottom of each column. This way you can see the vote totals for all candidates at once. It will also come in handy as you get to later rounds.
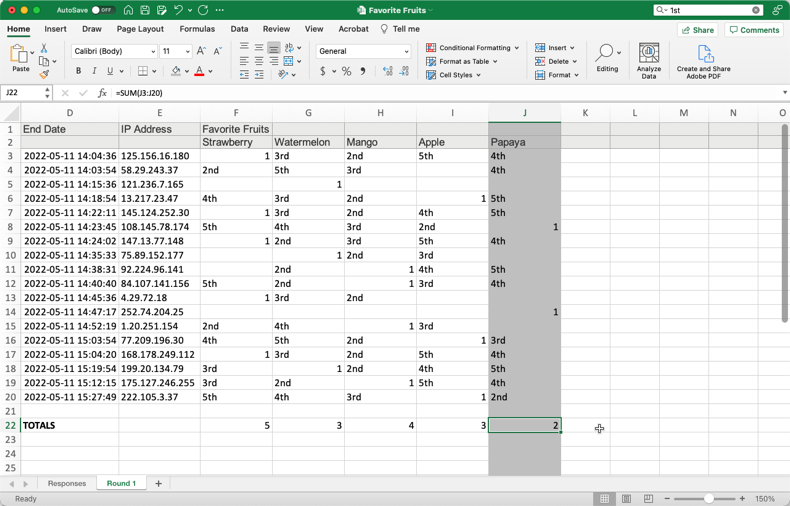
The SUM function is your friend here. Type in =SUM(FirstCell:LastCell). In the example, this would be =SUM(F3:F20) to get the total for the candidate named Strawberry. Then copy/paste or fill right to get the totals for the other candidates.
You’ve now totaled up the votes for Round 1.
If a candidate gets to a majority, you’re done. The ranked choice calculation doesn’t kick in because you’ve got a candidate with clear majority support. But, any time there’s more than two choices there’s a good chance you’re going to end up needing to perform ranked choice eliminations and vote redistributions.
Look at the totals for each candidate. Find the candidate with the lowest votes. Change the background color of that candidate’s column to a shade of gray. This is the candidate whose votes need to be redistributed at the start of the next round.
Duplicate the “Round 1” sheet and then rename the new sheet to “Round 2” at the bottom of the spreadsheet.
Here’s how things should look at the end of Round 1…
Calculate subsequent rounds (and find the winner)
The elimination and redistribution process below will be repeated for as many rounds as necessary until a winner is found.
This is the core of ranked choice voting. As candidates are found to be unviable, they are eliminated. But, people who voted for that candidate still have a shot at having their preferences reflected in the eventual result. No wasted votes. No penalty for voting for your favorite even if it wasn’t likely to win.
Back in the spreadsheet, you’ll redistribute the eliminated candidate’s votes to each voter’s next ranked choice. Here’s how…
First, replace every occurrence of “1” in the eliminated candidate’s column with “0.” Then, looking across the row for each “0,” find that voter’s next ranked choice. This will be the highest rank you see in any column that isn’t grayed out (because that denotes this candidate was eliminated). Replace the text in that cell with “1.” You have now successfully redistributed that vote.
Once you’ve redistributed all the votes, look at each candidate’s totals. If a candidate reaches the winning threshold, you’re done. If not, highlight the lowest vote-getter’s column. Duplicate the sheet. Rename the sheet for the next round. Repeat.
Here’s how the ranked choice calculation plays out for the example…
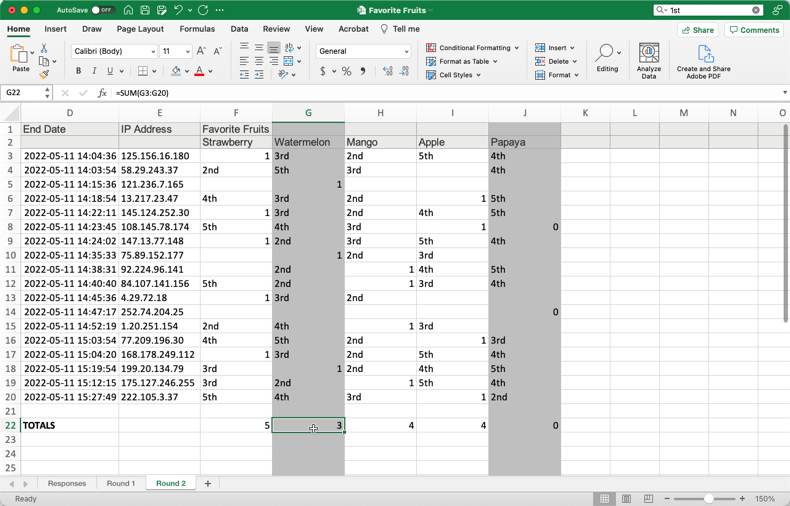
Example: Round 2
Papaya is the lowest vote-getter from Round 1. Its votes are redistributed to next ranked choices. No candidate has reached the winning threshold of 10 votes. So, we need to mark the lowest vote-getter from this round for redistribution in the next round (Watermelon - 3 votes).
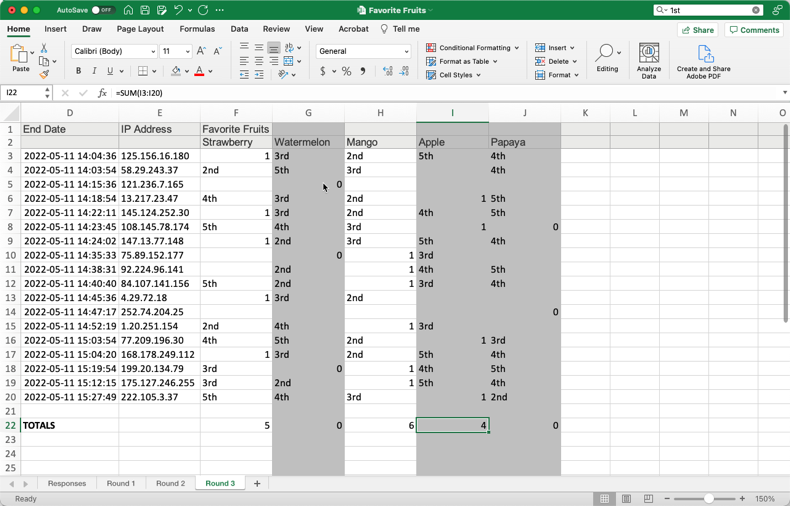
Example: Round 3
Watermelon is the lowest vote-getter from Round 2. Its votes are redistributed to next ranked choices. No candidate has reached the winning threshold of 10 votes. So, we need to mark the lowest vote-getter from this round for redistribution in the next round (Apple - 4 votes).
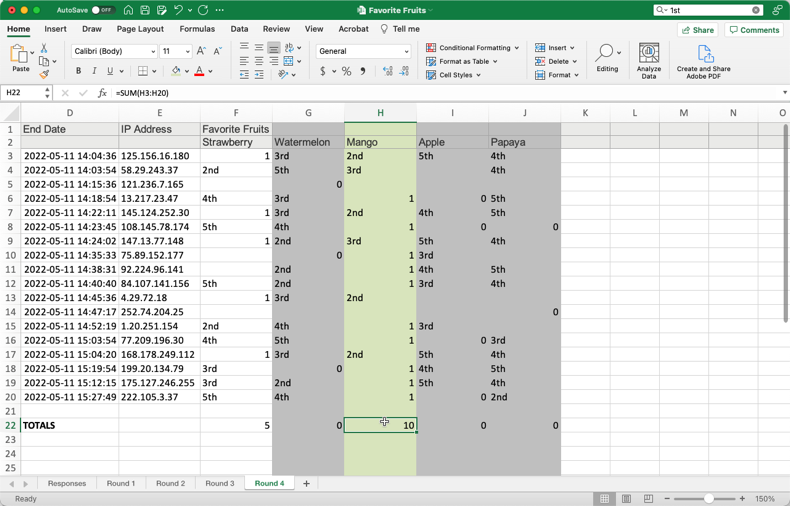
Example: Round 4
Apple is the lowest vote-getter from Round 3. Its votes are redistributed to next ranked choices. Mango reaches the winning threshold of 10 votes. We’ve found our ranked choice winner!
Observations on the Example Election
If you’re squinting your eyes looking at the example data, you may notice a couple interesting things going on:
The leader in the first round did not end up being the ultimate winner…
It turns out that Strawberry had a strong initial showing, but no breadth of support beyond its first rank voters. In a typical “most votes wins” election, Strawberry would have won with just under 28% of the vote. With ranked choice voting, the underlying preference of the majority of voters for something other than Strawberry is revealed.
It started with 18 votes and ended with 15…
You can see in the initial data that some voters did not rank all five candidates. Some only ranked one. Then, that candidate was eliminated.
When a voter has no more ranked choices left, the vote becomes “exhausted” or “inactive” and is not included in later rounds. That’s why, as a voter, it’s always in your best interest to rank as many choices as you can.
FAQ
How long will this take me to calculate?
It depends on three main factors: the number of candidates, the number of voters, and whether tiebreakers are needed.
The above example was on the very simple end of the spectrum. Only 5 candidates, 18 total votes, and no tiebreakers. Following this guide, you’d likely spend between 20-30 minutes on it.
But what if you had 12 candidates? 150 votes? Encountered tiebreakers? You’re now talking about multiple hours of tedium.
To make that more tangible, with 12 candidates you’ll likely end up having 11 rounds of eliminations and redistributions. With 150 votes, you’ll be scrolling up and down the spreadsheet (and 12 candidates will also have you scrolling left and right). If there’s a need for tiebreakers to determine who gets eliminated, then that may be a whole other set of calculations depending on how you choose to handle it.
Or…you could use RankedVote and have the results calculated instantly. 😉
How do I handle ties?
Ties can come up when determining the final winner or when determining who to eliminate in a round. There are simple methods that are quick, but don’t necessarily reflect voters’ preferences. There are other methods that reflect voters’ preferences, but take more time to calculate.
Simple
- Pick the First One – Quick and dirty. Gets you a result, but is biased to whichever candidate was placed first and is uncorrelated to voters' preferences.
- Flip a Coin – Removes the ordering bias, but is still uncorrelated with voters' preferences.
- Eliminate All at Once – In the event that multiple candidates are tied, but don't have as many votes combined as the next highest candidate, all can be eliminated in one batch.
Advanced
- Compare First Rank Votes – Go back to the Round 1 results and see if one of the candidates had more first rank votes. Underpinning this approach is the idea that a candidate with more first rank votes is more strongly preferred than the other candidate despite their current round vote totals being tied.
- Borda Count – This method looks across all votes received to see who was ranked highest. How to calculate Borda as well as variations on this approach can be found on Wikipedia.
What if no candidate reaches the winning threshold?
This can happen due to exhausted votes. In this scenario, the ranked choice winner is the candidate in the final round with the most votes. While this doesn’t quite get to the stated goal of majority support for the winning candidate, ranked choice voting is still uncovering the candidate with the broadest support amongst all options.